Black Student Success Initiative
Student Enrollment and Performance Trends
To understand the impact and necessity of the Black Student Success Initiative, we present a number of trends and insights into the experience of Black students at Fresno State.
Applicant, Admit, and Enrollee Trends
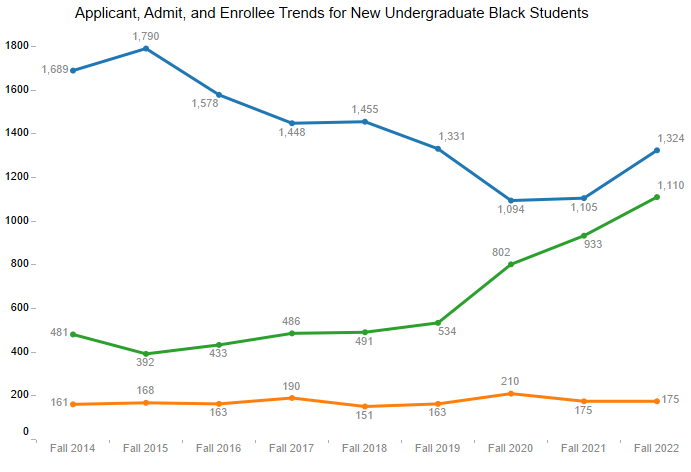
Fresno State applicant data shows that while the number of Black undergraduate applicants is on par with pre-pandemic levels, the number of Black undergraduate applicants has decreased by 26% since Fall 2015. This decrease can be seen for students applying from in and out of our service area (Fresno, Madera, Kings, and Tulare). Fresno State admissions data shows that the number of Black undergraduate student admissions has an increase of 107.8% from Fall 2019 (n = 534) to Fall 2022 (n = 1110), but the number of Black students enrolling at Fresno State has remained steady between 151-175. This indicates that while the admittance rate for Black students has been increasing steadily over the last several years, the yield rate for Black students is decreasing.
The proportion of new Black undergraduate applicants to Fresno State is evenly split between males and females (average of 50% between Fall 2014-Fall 2022). This even split, however, shifted slightly when looking at the proportion of new undergraduates who were admitted, but did not enroll. Prior to the COVID-19 pandemic, the proportion of Black undergraduate students who were admitted but did not enroll was between 58%-66% female. Since Fall 2020, this has evened out to an almost 50% split between males and females. To break it down further, in Fall 2012, 218 out of 814 (27%) Black female applicants and 158 out of 832 (19%) Black male applicants were admitted to Fresno State but did not enroll. In Fall 2022, 449 out of 630 (71%) Black female applicants and 482 out of 689 (70%) Black male applicants were admitted to Fresno State but did not enroll.
First-Time Full-Time Freshmen
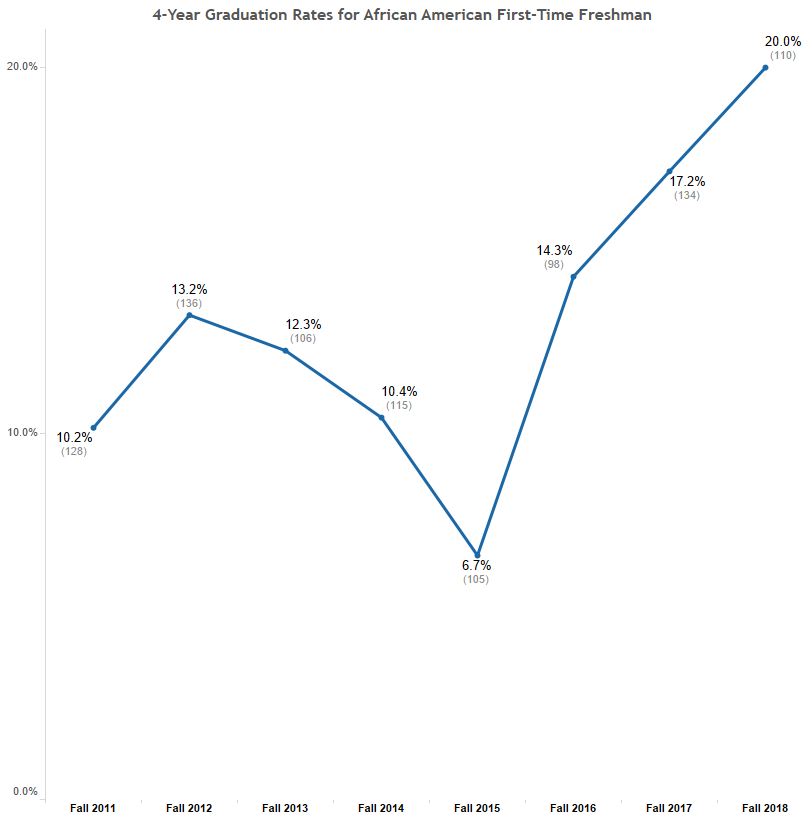
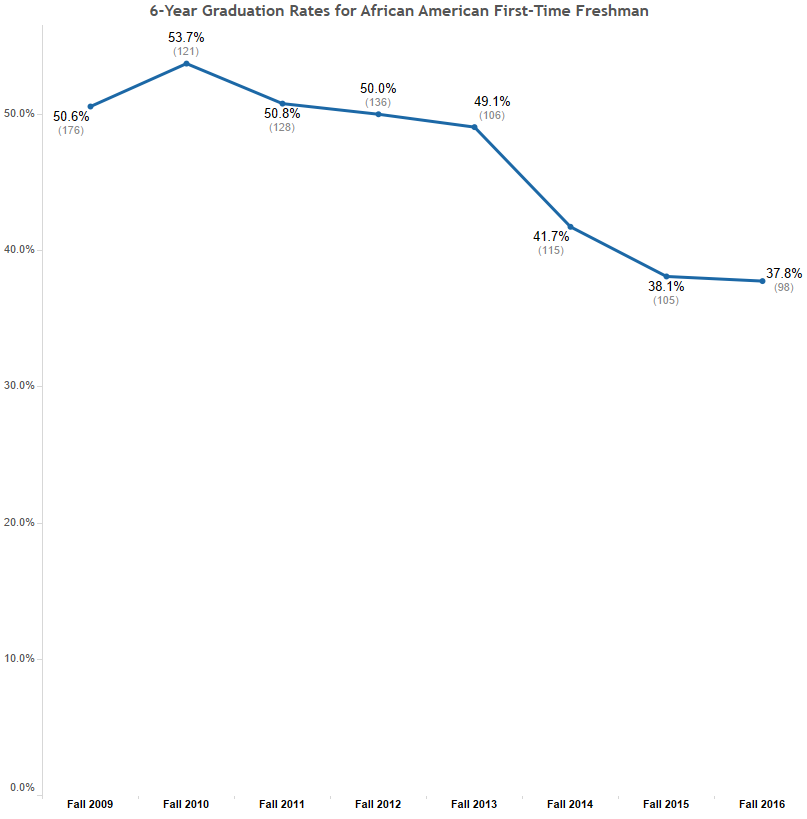
There has been a steady increase in the four-year graduation rates for first-time full-time freshmen who entered the university in the cohorts fall 2011 (15.3%) to Fall 2018 (27.8%). This trend also holds true for our Black full-time first-time freshmen who entered the university between fall 2011 (10.2%) and fall 2018 (20%) cohorts. However, while the six-year graduation rates for first-time full-time freshmen have remained steady around 56% (fall 2013 to fall 2016 cohorts), Black first-time full-time freshmen students’ six-year graduation rate has experienced a decrease by 15.9 percentage points since the Fall 2010 cohort (53.7% to 37.8%).
First-Time Full-Time Transfers
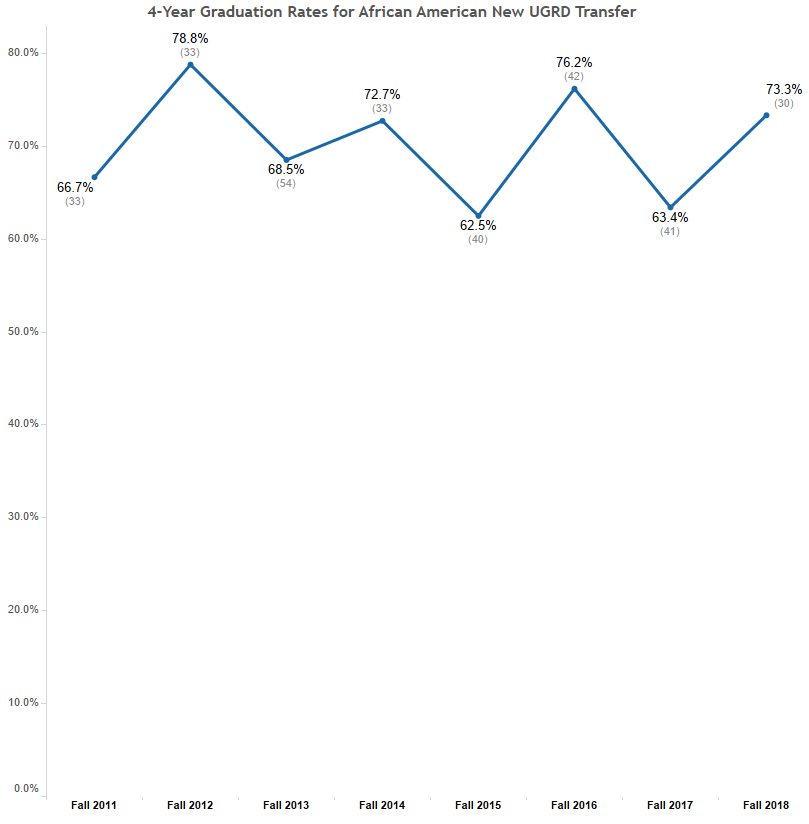
There has been a 13 (%) percentage point increase (26.7% to 39.7%) in two-year graduation rates for first-time, full-time undergraduate transfer students from the fall 2013 to fall 2020 cohorts. This trend holds true for our Black first-time full-time undergraduate transfer students with a 22.4 percentage point increase (16.7% to 39.1%) from fall 2013 to fall 2020 cohorts. The four-year graduation rates for first-time, full-time undergraduate transfer students have increased by five percentage points between the fall 2011 to fall 2018 cohorts (75.0% to 80.2%). The four-year graduation rate for Black first-time, full-time transfer students from the same set of cohorts have not experienced the same steady increase. This group of students’ graduation rates have remained between 62% to 78% and fluctuates by about 10 percentage points for each cohort.
For more information on BSSI, contact:
Dr. De Anna Reese
Faculty Advisor, Black Student Success Initiative
Professor, Department of History and Africana Studies Program
dreese@mail.fresnostate.edu